Risk-Reward Ratio Calculator
Calculate Your Trade Risk-Reward Ratio
The risk-reward ratio measures your potential profit against your potential loss. A 1:2 ratio means you risk $1 to make $2. Professional traders aim for at least 1:2.
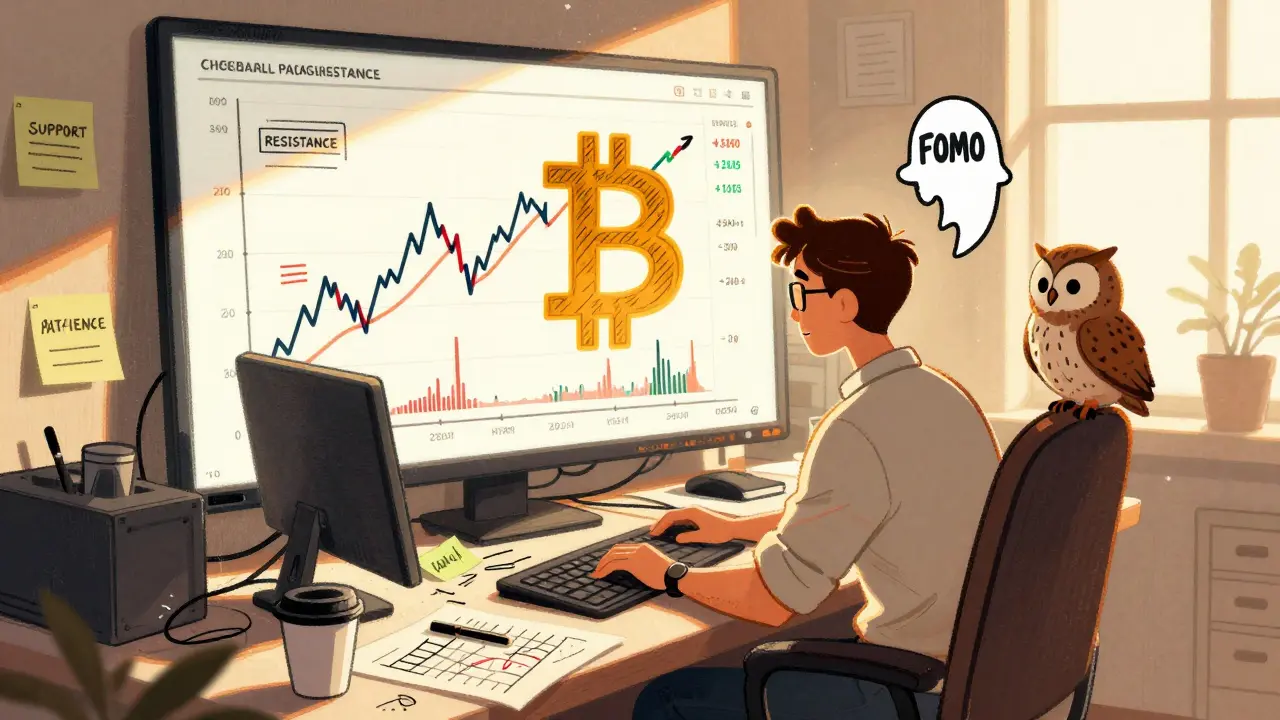
Technical analysis for cryptocurrency isn’t magic. It’s not a crystal ball. But for millions of traders, it’s the only map they have in a market that moves fast, swings hard, and rarely listens to news headlines. If you’ve ever stared at a Bitcoin chart wondering whether to buy, sell, or wait - you’re already using technical analysis, even if you don’t realize it.
How Technical Analysis Works in Crypto Markets
At its core, technical analysis for cryptocurrency looks at one thing: price. Not why the price moved. Not what news came out. Just what happened. Did it go up? Down? How fast? How much volume backed that move? That’s it.
It’s built on five basic ideas:
- Price reflects everything - all news, all fear, all hype, all insider info - is already baked into the current price.
- Prices move in trends - up, down, or sideways - and those trends tend to stick around.
- History repeats itself because humans are emotional creatures. Fear and greed don’t change just because the asset is crypto.
- Chart patterns matter - not because they’re magical, but because enough people see them and act on them, making them self-fulfilling.
- The market is always right - even if you think a coin is worthless, if the price is rising, the market says otherwise.
These ideas came from old-school Wall Street, thanks to Charles Dow in the 1800s. But they work even better in crypto. Why? Because crypto markets are more emotional. No earnings reports. No balance sheets. Just traders reacting in real time. That creates clearer patterns.
Key Tools Every Crypto Trader Uses
You don’t need fancy software. Most exchanges - Binance, Coinbase Pro, Kraken - give you free charting tools. But here are the five tools most traders actually use:
- Support and resistance levels: These are price zones where the market has bounced before. Support is the floor - where buyers step in. Resistance is the ceiling - where sellers take over. Watch these closely. When price breaks through resistance, it often keeps going up. When it drops below support, it usually keeps falling.
- Trend lines: Draw a line connecting two or more lows (for uptrends) or highs (for downtrends). If price keeps respecting that line, the trend is alive. Break the line? The trend might be done.
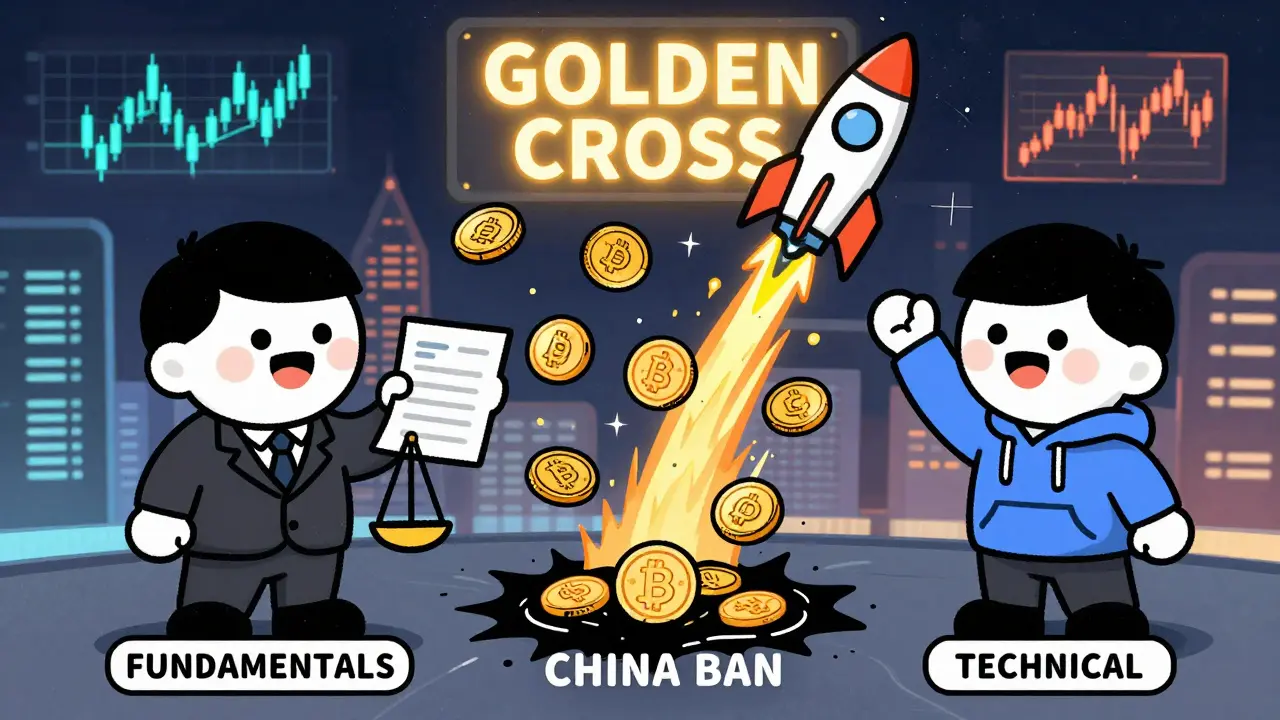
- Moving averages: These smooth out price data. The 50-day and 200-day moving averages are the most watched. When the 50-day crosses above the 200-day, it’s called a “Golden Cross” - a signal many traders see as bullish. When it crosses below, it’s a “Death Cross” - a red flag.
- Relative Strength Index (RSI): This measures how fast price is moving. On a scale of 0 to 100, above 70 means the asset might be overbought (time to sell). Below 30 means it might be oversold (time to buy). But don’t rely on it alone. In strong trends, RSI can stay over 70 for weeks.
- Bollinger Bands: These are two lines around a moving average that expand and contract based on volatility. When price hits the upper band, it’s often overextended. When it hits the lower band, it’s often oversold. But again - context matters.
These tools aren’t perfect. But when they line up? That’s when traders get confident. For example, in late 2024, Bitcoin formed a “cup and handle” pattern on weekly charts. At the same time, the 200-day moving average was rising, RSI was bouncing off 30, and volume spiked on the breakout. That combination led to a 227% rally over three months.
Technical Analysis vs. Fundamental Analysis
People confuse technical analysis with fundamental analysis all the time. They’re not the same.
Technical analysis asks: What is the price doing?
Fundamental analysis asks: Why is it doing it?
Fundamental analysis looks at things like: Who’s building the blockchain? How many active wallets? Is there real adoption? Is the team credible? It’s great for long-term holds - think “HODLing” Bitcoin for five years.
Technical analysis is for trading. It’s for spotting short-term moves - hours, days, weeks. It doesn’t care if a project has 10,000 users or 10 million. If the chart shows a breakout, it’s a signal.
Here’s the reality: In crypto, fundamentals can get ignored for months. In 2021, Ethereum was stuck at $3,000 for weeks even though DeFi usage kept growing. Only when the chart broke out did money flood in. That’s technical analysis at work.
But here’s the flip side: In September 2021, China banned crypto trading. Bitcoin dropped 30% in one day - even though every technical indicator was screaming “buy.” No chart pattern could predict that. That’s why smart traders don’t rely on one method alone.
Why Some Traders Love It - And Others Hate It
Dr. Alexander Elder, a veteran trader and author of Trading for a Living, says crypto is the perfect place for technical analysis. “Crypto markets are driven by emotion - not earnings calls or Fed meetings. That creates predictable cycles of fear and greed. Those cycles show up clearly on charts.”
But not everyone agrees. Dr. Nouriel Roubini, the economist known as “Dr. Doom,” calls it “astrology for investors.” His point? In a market with no regulation, no real value anchor, past price patterns mean nothing.
So who’s right? Both, in a way.
Here’s what the data shows:
- According to Kraken’s backtesting, a single indicator like MACD has only a 58% success rate.
- But when three indicators - say, RSI, moving average crossover, and volume spike - all line up? Accuracy jumps to 82%.
- TradingView data from January 2025 shows the 200-day moving average is used by 68% of active crypto chartists. RSI? 62%. Bollinger Bands? 57%.
- On Reddit, a trader turned $1,000 into $15,000 using just Fibonacci retracements and volume spikes on 4-hour charts.
- But another trader lost $20,000 because he trusted a “head and shoulders” pattern - then Ethereum pumped 40% on a surprise AWS partnership.
The lesson? Technical analysis works best when it’s not the only tool you use.
How to Start - Without Getting Overwhelmed
You don’t need to learn 20 indicators. Start with three:
- Learn candlestick patterns - especially doji, hammer, and engulfing bars. They show you where sentiment shifts.
- Mark support and resistance on your charts. Look at the last 3-6 months of price action. Where did price reverse?
- Use the 50-day and 200-day moving averages. Watch for crossovers. Don’t trade on them alone - wait for volume to confirm.
Use free tools: TradingView’s basic plan, or the charts on Binance or Coinbase Pro. No need to pay for Pro yet.
Here’s the biggest mistake beginners make: They use 5-minute charts to make 3-month decisions. That’s like using a magnifying glass to read a map. You’ll see noise, not direction.
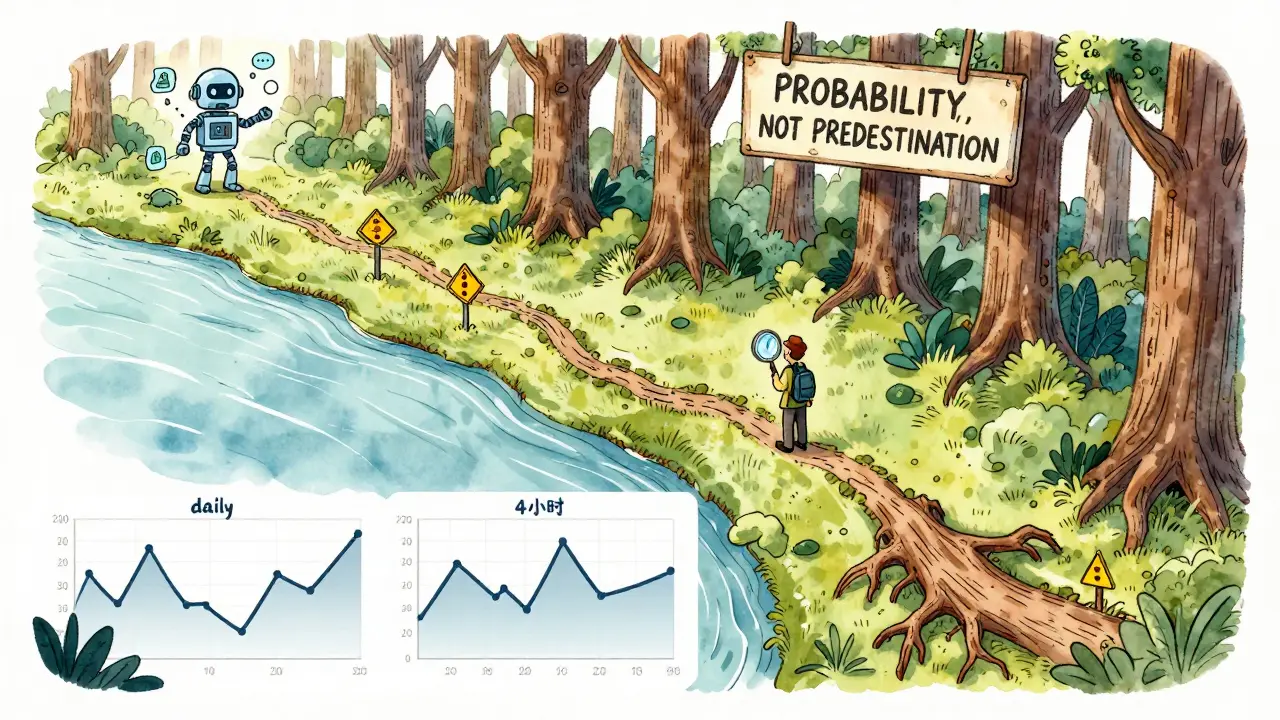
Instead, use multi-timeframe analysis:
- Start with the weekly chart - what’s the big trend?
- Then check the daily - is it confirming?
- Only then look at the 4-hour or 1-hour chart to pick your exact entry.
Professional trader Peter Brandt’s tutorial on this method has over 450,000 views for a reason. It works.
The Future of Technical Analysis in Crypto
Technical analysis isn’t dying - it’s evolving.
Platforms like TradingView now offer crypto-specific tools: funding rate heatmaps, open interest trends, and perpetual futures data layered on top of traditional charts.
Kraken and Glassnode have started blending on-chain data - like wallet activity and exchange outflows - directly into technical charts. That’s powerful. For example, if RSI shows oversold conditions but exchange net outflows are rising (meaning people are moving coins off exchanges to hold), that’s a stronger buy signal.
AI is coming too. TrendSpider, a startup that raised $22 million in early 2025, uses machine learning to auto-detect chart patterns with 89% accuracy. But here’s the catch: AI finds patterns humans miss - but it also finds false ones. That’s why the most successful traders now combine AI tools with their own judgment.
And here’s the real shift: Institutional adoption is growing. After the SEC approved spot Bitcoin ETFs in May 2024, technical patterns became 23% more reliable, according to Kraken. Why? Because big money doesn’t trade on memes. They use charts. And when they do, the patterns start working better.
But there’s a warning: Algorithms now make up 65% of crypto trading volume. That means patterns can get front-run. What worked last month might not work next month. The market is adapting.
Final Thoughts: Is It Worth It?
Yes - if you use it right.
Technical analysis for cryptocurrency won’t tell you which coin will be worth $1 million in 2030. But it can tell you when to buy, when to sell, and when to stay out. It gives you a framework to make decisions based on what’s happening now - not what someone on Twitter says will happen.
It’s not a guarantee. It’s a probability game. And in crypto, where volatility is the norm, knowing the odds is better than guessing.
Start simple. Watch price. Watch volume. Watch the trend. Don’t overcomplicate it. And never risk more than you can lose.
Because in the end, technical analysis doesn’t predict the future. It helps you read the present - and act on it before the crowd does.
Is technical analysis reliable for cryptocurrency trading?
Technical analysis can be reliable when used correctly - but not as a standalone system. It works best when multiple indicators confirm each other, and when combined with volume and context. Backtesting shows that single indicators have around 58% accuracy, but three converging signals can push that to 82%. However, it fails during major news events like regulatory bans or sudden partnerships, where fundamentals override chart patterns.
Do I need to pay for software to do technical analysis?
No. Most major exchanges like Binance, Coinbase Pro, and Kraken offer free charting tools with basic indicators like moving averages, RSI, and support/resistance lines. TradingView’s free tier is also fully functional for beginners. Paid plans (like TradingView Pro at $14.95/month) add advanced features like alerts and custom scripts, but aren’t necessary to start.
What are the best technical indicators for crypto?
The most widely used indicators among crypto traders are the 200-day moving average (used by 68% of chartists), RSI (62%), and Bollinger Bands (57%). Support and resistance levels are equally important - often more so than indicators. Many successful traders focus on price action and volume first, then use indicators to confirm.
Can technical analysis predict Bitcoin’s next big move?
No indicator can predict the future with certainty. But technical analysis can identify high-probability setups. For example, the “Golden Cross” (50-day MA crossing above 200-day MA) preceded 78% of major Bitcoin rallies between 2017 and 2024. However, these signals only work when confirmed by volume and trend context. A breakout without volume is often a fakeout.
Why do some people say technical analysis doesn’t work in crypto?
Critics argue that crypto is too volatile and manipulated for historical patterns to matter. Events like China’s 2021 ban or Elon Musk’s tweets can wipe out technical setups overnight. Also, algorithmic trading now makes up 65% of volume, which can erase predictable human patterns. But this doesn’t mean technical analysis is useless - it just means it needs to be used with awareness of market context and risk management.
How long does it take to learn technical analysis for crypto?
Most beginners become proficient in 3-6 months with consistent practice. The first 4-6 weeks should focus on reading candlesticks and identifying support/resistance. After that, learning 2-3 indicators and practicing on historical charts builds confidence. The key is not memorizing patterns - it’s learning to read price action and manage emotions.
LOL technical analysis in crypto? More like astrology with charts. I saw a guy lose $50k because he trusted a 'head and shoulders' pattern right before Ethereum went parabolic on an AWS partnership. Charts don't care if your favorite dev team just got acquired by Google.
You people are clueless. In America we know real trading. These so-called 'indicators' are for amateurs. Real traders watch volume and order flow - not some 50-day MA garbage. If you're not using Level 2 data on Binance, you're playing with toys.
I started with just support/resistance and candlesticks. No indicators. Just price and volume. Took me 3 months to stop overcomplicating it. Now I make consistent profits. 🙏
This is why Africa will never win in crypto. You all think charts predict the future. The future is built by builders - not chart readers. I saw a guy trade a meme coin for 1000x while you were busy drawing trendlines.
Kraken's backtesting data shows 58% accuracy for single indicators... but 82% when three converge? That's not magic - that's statistics. Also, volume confirmation is non-negotiable. A breakout without volume is just a mirage.
I used to think moving averages were gospel until I got wiped out on a Fed announcement. Now I use them as filters not signals. Price tells the story. Indicators just underline the words
I love how people treat TA like it's science. It's psychology. It's collective belief. When enough people believe a level is support, it becomes support. That's not math. That's human behavior. And humans are messy.
You all sound like you're trying to sell a course. Crypto is manipulated by whales and bots. Your 'golden cross' is just a trap set by someone with 10x your capital. Wake up.
Start simple. Watch the 200-day MA. Watch volume spikes. Wait for price to confirm. Don't chase. I turned $500 into $8k this way. No fancy tools. Just patience and discipline.
I was skeptical too. But after 6 months of paper trading with just support/resistance + RSI, I finally made my first real trade. It wasn't perfect. But it was mine. And that's what matters.
I used to be all in on TA... until I realized I was just chasing my own emotions. Now I use it as a checklist, not a crystal ball. If 3 indicators line up AND volume is up AND no major news is coming? Then I act. Otherwise I wait. 🤷♀️
Technical analysis isn't about predicting the future. It's about understanding the present. The market is always right - even when you're emotionally attached to a coin. Let price speak. Listen. Don't argue with it.
I teach this to my nephew in India. He's 16. Started with free TradingView. Now he's making side income. The key? Timeframes. He watches weekly for trend, daily for context, 4h for entry. No overtrading. Just clean setups.
I'm from the US, but I've traded in Nigeria, Brazil, and Thailand. The charts work the same everywhere. Human fear and greed don't care about borders. TA is universal. It's not about where you live - it's about how you think.
I used to hate TA. Thought it was snake oil. Then I watched a whale get liquidated after ignoring a clear double bottom on the 4h chart. He was all in on 'fundamentals'. Lesson learned: price always wins.
The 200-day MA is the most reliable thing in crypto. Not because it's magic - because thousands of traders watch it. That's why it works. It's a self-fulfilling prophecy. And that's the whole point.
Beginners think they need to master 10 indicators. No. Master one. Watch it for 3 months. Then add another. Progress, not perfection. I've seen people burn out trying to be gurus. Don't be one of them.
AI finds patterns humans miss. But it also finds patterns that don't exist. I use TrendSpider as a filter not a signal. My brain still makes the call. Tech is a tool. Not a replacement for judgment.
I lost $20k on a 'head and shoulders' pattern. Then I found a guy on Reddit who used the same setup and made $150k. Difference? He waited for volume. I didn't. So here's my advice: volume is your best friend. Ignore it at your own risk.
India doesn't need your Western charts. We trade on WhatsApp groups and Telegram leaks. Your 'Bollinger Bands' are useless when a minister tweets at 3AM. Real traders don't wait for confirmation - they anticipate chaos.