
The crypto market doesn't just move on numbers. It moves on feelings. When Bitcoin crashes or Ethereum spikes, it’s rarely because of a single transaction. It’s because thousands of traders suddenly feel fear, greed, or uncertainty. That’s where sentiment indicators come in. They are the compasses that help you navigate the emotional chaos of the blockchain space.
If you’ve ever bought at the top because everyone was cheering, or sold at the bottom because panic was everywhere, you know how dangerous ignoring sentiment can be. In 2026, we have powerful tools to measure this mood. But most people still use them wrong. They look at one red line on a chart and guess. Real edge comes from combining on-chain data with social signals and understanding what those metrics actually mean for your wallet.
What Are Sentiment Indicators in Crypto?
In traditional finance, sentiment is often measured by surveys like the Conference Board’s Consumer Confidence Index. In crypto, it’s faster, louder, and more volatile. A sentiment indicator is a metric or tool that quantifies the collective emotion, opinion, or psychological state of market participants regarding a specific asset or the broader market.
These indicators fall into three main buckets:
- Social Sentiment: What people are saying on X (formerly Twitter), Reddit, Discord, and Telegram. This includes keyword frequency, hashtag trends, and influencer posts.
- On-Chain Sentiment: What wallets are doing. Are long-term holders selling? Is exchange inflow spiking? These actions reveal conviction, not just talk.
- Derivative Sentiment: What traders are betting on via futures and options. Put/call ratios and funding rates show if the market is overly leveraged bullish or bearish.
The key insight? Price follows liquidity, but liquidity follows sentiment. If you can spot the shift in sentiment before the price reacts, you get ahead of the crowd.
Top Social Sentiment Tools for 2026
Social media is the heartbeat of crypto culture. A tweet from a major influencer can move a small-cap altcoin by 50% in minutes. To track this, you need tools that go beyond simple word counts.
| Tool | Best For | Key Feature | Limitation |
|---|---|---|---|
| Santiment | On-chain + Social Hybrid | Active Address tracking combined with social mentions | Steep learning curve for beginners |
| LunarCrush | Altcoin Discovery | "Galaxy Score" combines social engagement with price action | Lagging indicator during extreme volatility |
| The TIE | Real-time News & Sentiment | AI-driven news scoring and whale alert integration | Premium pricing for advanced features |
| Alternative.me | Beginner Overview | Fear & Greed Index (free and widely cited) | Lacks granular token-specific data |
Santiment is a data analytics platform that provides on-chain and social metrics for cryptocurrencies. It stands out because it connects social buzz to actual wallet activity. If people are talking about Solana, Santiment shows you if their wallets are also buying SOL. If they’re just talking, it’s noise. If they’re buying, it’s signal.
LunarCrush is a social intelligence platform that tracks cryptocurrency performance across social networks. Its Galaxy Score is popular among traders looking for the next breakout coin. However, be careful. High social engagement can sometimes mean a pump-and-dump scheme rather than genuine adoption.
Decoding On-Chain Sentiment Metrics
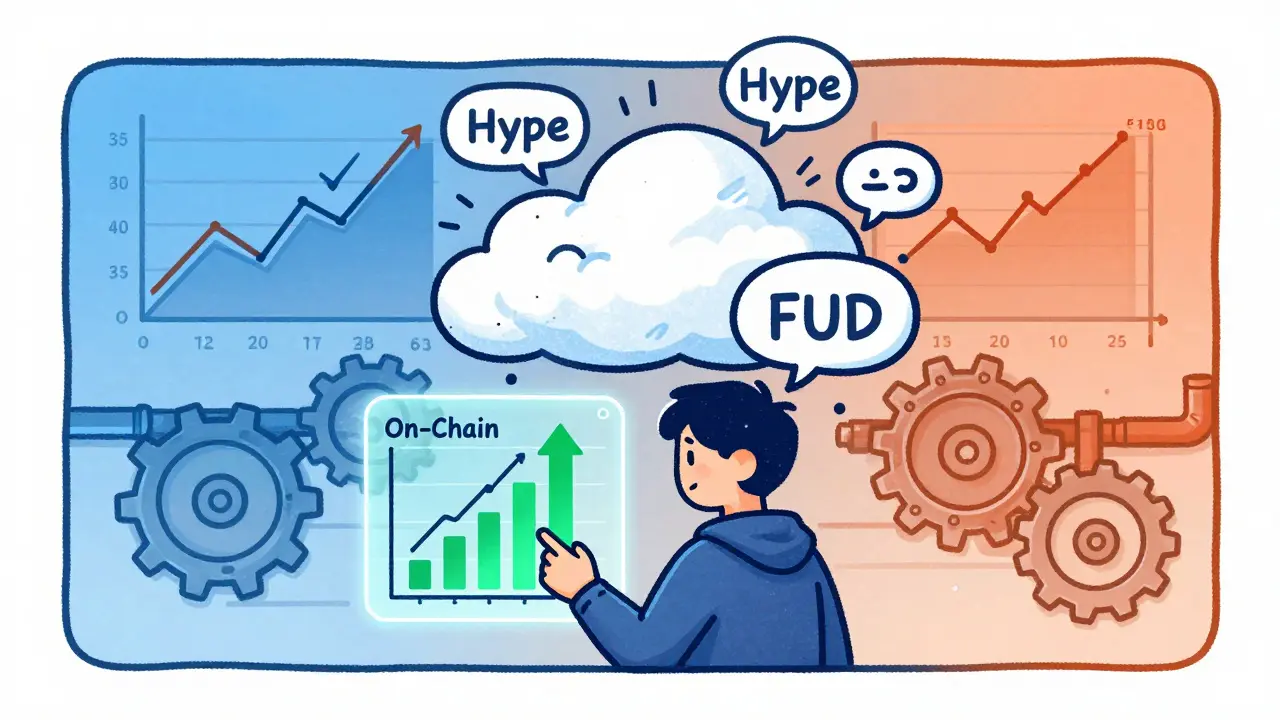
Social media can be faked. Bots can create fake hype. On-chain data cannot lie. The blockchain is public ledger. Every transaction is recorded. Smart traders use these metrics to gauge true market sentiment.
Exchange Net Flow
This measures the difference between coins moving onto exchanges (to sell) and off exchanges (to hold).
- Positive Net Flow (Inflow): More coins are entering exchanges. This usually indicates selling pressure. Traders are preparing to cash out. Sentiment is bearish.
- Negative Net Flow (Outflow): More coins are leaving exchanges. This indicates accumulation. Investors are moving assets to cold storage. Sentiment is bullish.
For example, if Bitcoin exchange reserves drop significantly over a week while price remains stable, it suggests strong holding conviction despite market fears.
MVRV Ratio (Market Value to Realized Value)
The MVRV ratio compares the current market cap to the "realized cap" (the value of all coins at the last time they moved).
- MVRV > 3.5: Historically, this has marked cycle tops. Most holders are in significant profit. Greed is high. Risk of correction is elevated.
- MVRV < 1.0: This has marked cycle bottoms. Most holders are underwater. Fear is high. Buying opportunity may be present.
This metric helps distinguish between short-term price noise and long-term value shifts. It answers the question: "Is the current price justified by the historical cost basis of the network?"
Long-Term Holder Supply
Coins held for more than 155 days are considered long-term holder supply. When this percentage increases, it means early adopters and institutions are accumulating. When it decreases, it means veterans are distributing to newer buyers. Tracking this via platforms like Glassnode gives you insight into whether smart money is entering or exiting the market.
Understanding Derivatives Sentiment
Spot prices tell you where the market is. Derivatives tell you where the market expects to go. Futures and options markets are where the big players hedge and speculate.
Funding Rates
In perpetual swaps, funding rates are payments made between long and short positions to keep the contract price close to the spot price.
- High Positive Funding: Longs pay shorts. This means too many people are leveraged bullish. A "long squeeze" (rapid price drop forcing longs to liquidate) becomes likely.
- Negative Funding: Shorts pay longs. This means excessive bearish leverage. A "short squeeze" (rapid price rise forcing shorts to cover) becomes likely.
Platforms like Coinglass provide real-time funding rate data across major exchanges. If you see extremely high positive funding on Ethereum while the price stalls, it’s a warning sign. The market is overcrowded on the upside.
Put/Call Ratio
This measures the volume of put options (bets on price drops) versus call options (bets on price rises).
- High P/C Ratio (>1.5): Heavy hedging against downside. Extreme fear. Often a contrarian buy signal.
- Low P/C Ratio (<0.5): Heavy speculation on upside. Extreme greed. Often a contrarian sell signal.
Options data is less transparent than spot data, but platforms like Deribit publish order book depth. Watching large option expirations can also cause pinning effects, where price gets stuck near a major strike price.
How to Combine Indicators for Better Decisions
Using one indicator is risky. Using five creates clarity. Here’s a practical framework for 2026:
- Check the Macro Sentiment: Start with the Fear & Greed Index. Is the market in extreme fear (<20) or extreme greed (>80)? This sets the baseline risk level.
- Verify with On-Chain Data: Look at Exchange Net Flows. If fear is high but net flows are negative (coins leaving exchanges), the fear might be irrational. Smart money is buying.
- Assess Leverage: Check Funding Rates. If sentiment is fearful but funding rates are negative, shorts are crowded. A bounce is probable.
- Scan Social Volume: Use LunarCrush or Santiment to see if specific tokens are gaining attention. Is the buzz aligned with on-chain growth?
Example Scenario: Bitcoin is dropping. Fear & Greed is at 15 (Extreme Fear). However, Glassnode shows massive outflows from exchanges. Funding rates are slightly negative. Social volume is low (no panic selling discussion). Conclusion: Distribution is ending. Accumulation is beginning. Consider dollar-cost averaging.

Pitfalls to Avoid
Even with great tools, human error persists. Watch out for these common mistakes:
- Confirmation Bias: Only looking at indicators that support your existing position. If you’re long, ignore the rising put/call ratio. This leads to blown accounts.
- Overfitting Past Data: Just because MVRV worked in 2021 doesn’t guarantee it works in 2026. Market structures change. Always test strategies on recent data.
- Ignoring Context: A spike in social sentiment might be due to a hack or regulatory news, not organic growth. Always read the headlines behind the metrics.
- Relying on Lagging Indicators: Many sentiment tools update hourly or daily. In fast-moving markets, this delay can cost you entries and exits. Use real-time feeds when possible.
Future Trends in Sentiment Analysis
The field is evolving rapidly. By late 2026, we expect to see:
- AI-Driven Nuance Detection: Current tools struggle with sarcasm and meme culture. New NLP models will better interpret context, distinguishing between ironic hate-watching and genuine FUD.
- Private Data Integration: With zero-knowledge proofs, future tools may allow users to analyze aggregated private wallet behavior without compromising individual privacy.
- Cross-Asset Correlation: Sentiment tools will increasingly link crypto mood to traditional finance indices (S&P 500, Nasdaq) and macroeconomic data (interest rates, inflation).
The goal isn’t to predict the future perfectly. It’s to understand the present clearly. Sentiment indicators give you an edge by revealing what the crowd feels, so you can act rationally when they act emotionally.
What is the best free sentiment indicator for crypto?
The Alternative.me Fear & Greed Index is the most accessible free tool. It provides a daily score from 0 to 100 based on volatility, momentum, social media, and dominance. While basic, it effectively captures broad market extremes.
Can sentiment analysis predict crypto prices accurately?
No tool predicts prices with 100% accuracy. Sentiment indicators identify probabilities and market conditions. They work best when combined with technical analysis and fundamental research to confirm trends.
Why do funding rates matter for sentiment?
Funding rates reveal leverage positioning. Extremely high positive rates indicate overcrowded long positions, increasing the risk of a sharp correction as longs are liquidated. Negative rates suggest excessive shorting, potentially leading to a short squeeze.
What is the difference between social and on-chain sentiment?
Social sentiment measures talk (posts, likes, mentions) which can be manipulated by bots. On-chain sentiment measures action (transactions, wallet movements) which requires capital commitment. On-chain data is generally considered more reliable for gauging true investor conviction.
How often should I check sentiment indicators?
For swing traders, daily checks are sufficient. For day traders, monitor real-time derivatives data like funding rates and order book depth. Avoid checking too frequently, as short-term noise can lead to emotional decision-making.
Oh, look at us, pretending we can quantify human emotion with a few lines of code and some fancy charts. It’s absolutely laughable how people treat these 'indicators' as gospel truth. You’re all just gambling with extra steps, dressing up your lack of discipline in the language of data science. The market doesn’t care about your feelings, and it certainly doesn’t care about your 'sentiment analysis.' It’s a rigged game, and you’re all too busy looking at screens to notice who’s pulling the strings. Typical.
Wait wait wait hold on a second because this article is basically telling you that if everyone is scared you should buy but what if everyone is scared for a reason like maybe the whole system is collapsing? I mean come on guys this is not rocket science it is basic economics 101 but nobody wants to listen because they want to get rich quick so here we are again repeating the same mistakes over and over again while the whales eat our lunch and laugh at us from their yachts oh the humanity!
I think it is really important to remember that tools are just tools and they cannot predict the future no matter how much data they have. We should all be kind to each other when discussing losses because trading is stressful and emotional support matters more than any chart pattern ever will.
The epistemological framework presented herein fundamentally misunderstands the ontological nature of market volatility. To suggest that sentiment drives price action is to ignore the underlying geopolitical hegemony and monetary policy decisions made by central banks in Washington. The American dollar remains the anchor of global liquidity, and any deviation from its trajectory is merely a correction within the broader capitalist paradigm. One must consider the dialectical tension between speculative excess and regulatory constraint before engaging in such superficial analysis. The true metric of value is not social media engagement but rather the sovereign power of the state backing the asset class.
I’ve been watching the MVRV ratio for a while now and it’s pretty interesting how it lines up with past cycles. Not saying it’s perfect but it gives a good sense of whether things are overheated or undervalued. Just something to keep an eye on alongside everything else.
Can someone explain why funding rates are so critical compared to just looking at spot price? I see them mentioned everywhere but I’m still trying to wrap my head around how they actually force liquidations in real time versus just being a lagging indicator of leverage.
Hey there! Great question about funding rates 🚀 Think of it like this: if everyone is betting the price goes up (longs), they have to pay the shorts to keep the perp contract price close to spot. If those rates get super high, it means the market is overcrowded with bulls. When new money stops coming in, those longs get squeezed out fast 💥 It’s like a pressure cooker! Always check Coinglass for real-time data 👀
i totally agree with the part about bots faking hype on twitter. its so exhausting trying to figure out what is real news and what is just paid shilling. i wish there was a way to filter out the noise better without paying for expensive subscriptions. its hard enough keeping up with prices let alone all this extra data.
hey rosie i feel ya man its tough out there. santiment is kinda pricey but sometimes free trials help. also try looking at glassnode for on chain stuff cause its pretty reliable even if the interface is a bit dry. dont let the noise get u down just focus on ur own strategy and take breaks ok?
We often forget that markets are psychological constructs. The numbers are real, but their meaning is assigned by collective belief. Understanding sentiment is essentially understanding the narrative. When the narrative shifts, the numbers follow. It is a dance between perception and reality.